Republic of Türkiye Ministry Of Agriculture And Forestry
General Directorate of Agricultural Reform


IPARD PROGRAMME STATISTICS
| Measures | Budget | Contracted Projects Except Terminated Projects | Aid paid to beneficiaries | |||||||
| Total Public Support (A) |
EU contribution 2014-2020 (B) |
Number (C) |
EU contribution (D) |
Number of completed projects (E) |
EU contribution (F) |
IPARD contribution (G) |
Total investment amount (H) |
%/2014-2020 (*1) |
||
| 101 | Investement in Agricultural Holdings | 448.560.000 | 336.420.000 | 472 | 95.499.081 | 123 | 32.397.657 | 43.189.428 | 63.316.856 | 9,62% |
| 103 | Processing and marketing | 234.960.000 | 176.220.000 | 237 | 62.310.922 | 18 | 5.108.750 | 6.811.666 | 13.597.117 | 2,89% |
| 302 | Diversification | 202.920.000 | 152.190.000 | 975 | 34.995.609 | 832 | 15.516.523 | 20.688.698 | 31.828.768 | 10,19% |
| Total | 886.440.000 | 664.830.000 | 1684 | 192.805.613 | 973 | 53.022.930 | 70.689.792 | 108.742.741 | 7,97% | |
| Updated 30.06.2018 *1: (A/G)% | ||||||||||
The budgets allocated by EU on the basis of
sectors and expense amounts are seen in the table above. Contracted budget
expense amount rate for the Investments
in Physical Assets of Agricultural Holdings (Measure 101) is 28,39%, for the
Investments in Physical Assets Concerning Processing and Marketing of
Agricultural and Fishery Products (Measure 103) is 8,2% and for the
investments to Farm Diversification and
Business Development (Measure 302) is 44,30%.
IPARD I RASULTS
| Support Amount Allocated on the Basis of Measures and Support Amounts Contracted and Paid | |||||||
| Measure | Allocated | Contracted Amount** | Paid Amount** | Rate (%) | |||
| Public | EU(% 75) | Public | EU(% 75) | Public | EU (% 75) | ||
| a | b | c | d | e | f | c/a | |
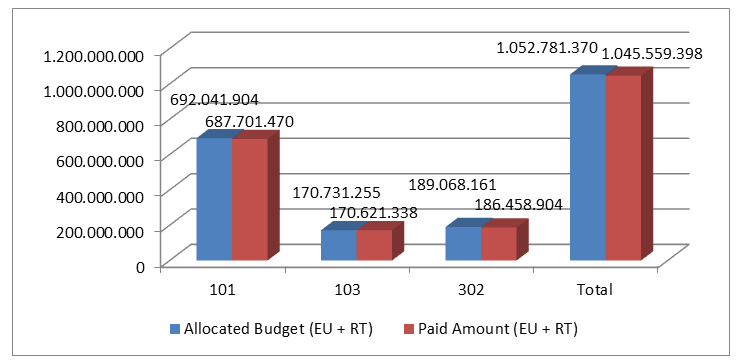
| 101 | 692.041.904 | 519.031.428 | 855.018.023 | 641.263.515 | 687.701.470 | 515.798.546 | 124 |
| Milk Producing | - | - | 515.558.153 | 386.668.614 | 402.551.554 | 301.936.112 | |
| Meat Producing | - | - | 339.459.870 | 254.594.902 | 285.149.915 | 213.862.434 | |
| 103 | 170.731.255 | 128.048.441 | 231.436.490 | 173.577.367 | 170.621.338 | 127.966.003 | 136 |
| Milk Processing | - | - | 83.213.723 | 62.410.292 | 56.423.135 | 42.317.351 | |
| Meat Processing | - | - | 72.912.770 | 54.684.577 | 52.419.882 | 39.314.911 | |
| Fruit and Vegetable Processing | - | - | 63.219.985 | 47.414.988 | 53.877.428 | 40.408.071 | |
| Processing of Fishery Products | - | - | 12.090.012 | 9.067.509 | 7.900.893 | 5.925.670 | |
| 302 | 189.068.161 | 141.801.121 | 222.004.877 | 166.503.654 | 186.458.904 | 139.844.708 | 113 |
| Diversification of Farm Activities | - | - | 101.237.682 | 75.928.258 | 96.322.476 | 72.241.853 | |
| Local Products and Handcrafts | - | - | 50.561.357 | 37.921.018 | 39.688.163 | 29.766.122 | |
| Rural Tourism | - | - | 67.253.087 | 50.439.815 | 48.489.569 | 36.367.711 | |
| Aquaculture | - | - | 2.952.751 | 2.214.563 | 1.958.694 | 1.469.020 | |
| 501* | 940.050 | 752.040 | 893.390 | 714.712 | 777.686 | 622.149 | 95 |
| TOTAL | 1.052.781.370 | 789.633.030 | 1.309.352.781 | 982.059.248 | 1.045.559.398 | 784.231.406 | 124 |
| 31.12.2016 | |||||||
1 billion 45 million € (99,3% of 1 billion 52 million € sum of which is 789 million € EU and 263 million € TR contribution under IPARD I Programme) has been paid to the beneficiaries in line with the Programme targets.

The budgets allocated on the basis of measures and expense amounts are seen in the table above. Budget expense amount rate for the investments to the meat and milk producing enterprises (Measure 101) is 99,3%, for the investments to processing and marketing of meat, milk, fruit and vegetables and fishery products (Measure 103) is 99,9% and for the investments to diversification of farm activities (Measure 302) is 98,6%.
Table for Number of Projects| Measure | Project Applications Taken | Contracted | Finalized |
|---|---|---|---|
| Meat and Milk Producing | 3931 | 2447 | 2193 |
| Milk Producing | 2119 | 1236 | 1088 |
| Meat Producing | 1812 | 1211 | 1105 |
| Processing of Milk, Meat, Fruit, Vegetable and Fishery Products | 832 | 495 | 438 |
| Milk Processing | 324 | 192 | 165 |
| Meat Processing | 225 | 127 | 113 |
| Fruit and Vegetable Processing | 240 | 151 | 141 |
| Processing of Fishery Products | 43 | 25 | 19 |
| Diversification of Farm Activities | 11.809 | 8.319 | 7.995 |
| Diversification | 10.413 | 7.508 | 7.292 |
| Local Products and Handcrafts | 653 | 370 | 327 |
| Rural Tourism | 675 | 412 | 355 |
| Aquaculture | 68 | 29 | 21 |
As seen on the table above; 62% of the project applications on the investments to the meat and milk producing enterprises have been contracted and approximately 90% of the contracted projects have been finalized. 59% of the project applications on the investments to processing and marketing of meat, milk, fruit and vegetables and fishery products have been contracted and 88% of the contracted projects have been finalized. 70% of the project applications on the investments to diversification of farm activities have been contracted and 96% of the contracted projects have been finalized.
 Republic of Türkiye Ministry Of Agriculture And Forestry
General Directorate of Agricultural Reform
Department of Managing Authority for EU Structural Adjustment
Eskişehir Road 9. Km,
ANKARA/TÜRKİYE
Website:
ipard.tarim.gov.tr

(c) 2016 Mana
